Documentation Index
Fetch the complete documentation index at: https://docs.getmonita.io/llms.txt
Use this file to discover all available pages before exploring further.
Instructions
To monitor a new tag follow these instructions:
- Make sure you have integrated Monita with the GTM container you would like to Monitor. See this article [Integrating with GTM Container] [TODO: ADD LINK]
- Go to the Monitoring home page
- Click ‘New Container’ (your integrated containers and tags will appear)
- Select the Account and Container you would like to Monitor
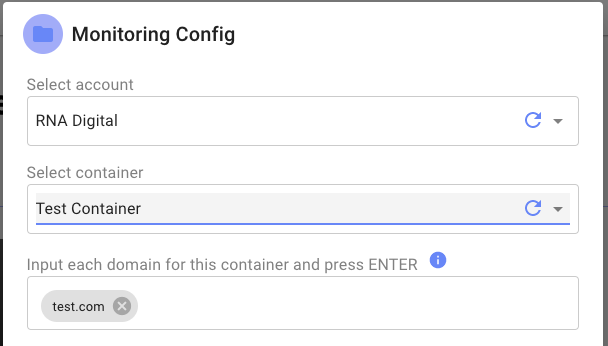
- Enter all Domains which this container is deployed to. This can be a root domain, or a subdomain.
- Select the Tags you would like to monitor within your container
Before proceeding to deployment please ensure that no one is creating/editing anything in the Google Tag Manager container which you are setting up.
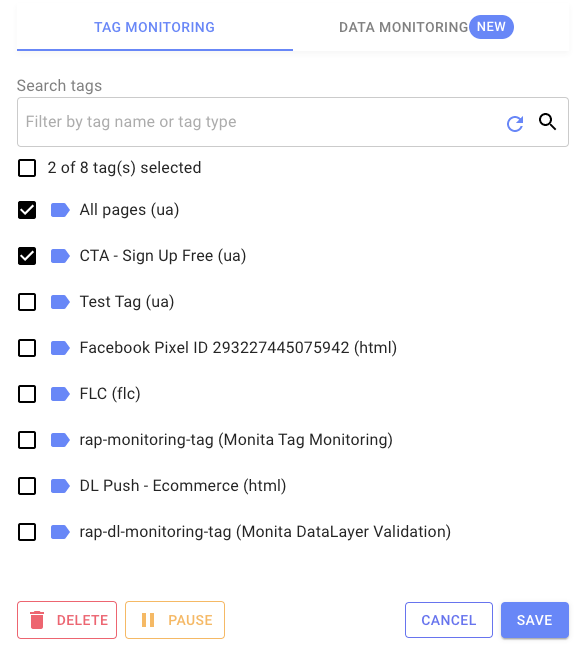
- Click ‘Monitor Tags’
This will begin deploying our Tag Template, Tag Monitoring Tag, Endpoint variable, Token Variable. The following message will appear:
7. Upon completion a summary message will appear in the bottom left indicating the amount of tags that have either been created, updated, removed or unmodified.
8. Enter into the target Google Tag Manager container and verify the deployment. For net new monitoring setups it should look like this (tags being monitored should be Modified as the bottom tag in this image):
9. You can either Preview or Submit your container to production.
If previewing tags, they will fire as usual, although traffic will not be admitted to Monita so that outliers are not introduced to your production data.
10. Your integration and GTM setup is now complete. You will now need to integrate to Google Data Studio or your Visualisation platform of choice.
To setup visualisation for your Tag Monitoring in Google Data Studio seeSetup Google Data Studio visualisation [TODO: ADD LINK]